 Research shows major growth in contactless and multi-application deployment, though price still remains key driver
In March 2010 Avisian Publishing and HID Global embarked on a research effort to gauge reader perceptions related to future trends in physical access control. The project produced an interesting look at both the current state and future direction of the security market. The following article highlights key findings from the research.
The methodology was straightforward. A 14-question survey was developed and made available for online response. Calls for participation were promoted via article postings and banner ads on Avisian’s ID technology focused Web sites. During a four-day period, 250 responses were collected, with approximately 150 from end users or issuers of access products and an additional 100 responses from industry representatives. For this review only end user responses were considered.
Questions focused on areas including:
Card technologies
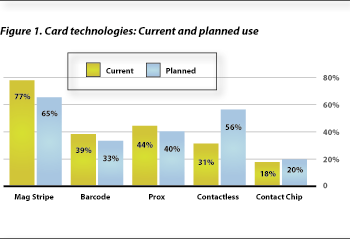 The initial questions explored card technologies currently deployed and plans for future implementations. Respondents were asked to select all that apply to the question: “Which card based technologies does your organization CURRENTLY SUPPORT?” More than 75% reported use of magnetic stripes and nearly 40% indicated that a bar code was used. Nearly 45% use proximity technology and about 30% indicated contactless technology was in place (see Figure 1).
When categories were evaluated in combination there were some interesting results. Two-thirds of all respondents indicate that they currently use proximity and/or contactless. This number jumps to 80% when asked about planned use of proximity and/or contactless.
While it will likely come as no surprise that contactless saw the largest level of growth from current to planned use, the size of that growth is dramatic. The use of contactless is anticipated to rise nearly 80%. Currently less than one in three users are issuing the technology but nearly six in 10 plan to deploy (see Figure 2).
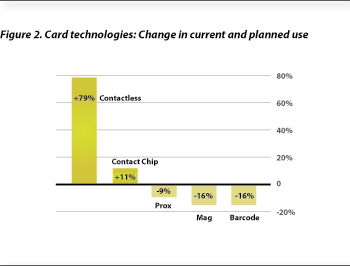 As expected, this dramatic rise in contactless usage will come at the expense of other technologies but surprisingly it is not proximity that will feel the bulk of the pinch. Proximity use remained strong with four out of 10 users reporting their intention to continue or initiate its use. That is a decline of less than 10% from current use levels. It is not, however, enough to account for the 80% rise in contactless.
The survey suggests that magnetic stripe and bar coded IDs will make up the bulk of the migration to contactless. Each technology experienced more than 15% declines and together made up 75% of the migration from a currently used technology to contactless.
Applications
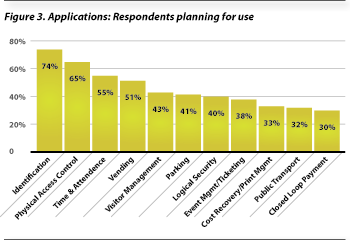 Moving from technologies to applications, respondents were asked to identify how they planned to use their cards in the future. Not surprisingly, identification and physical access topped the list at 75% and 65% respectively. Next came time and attendance and vending, both planned for use by more than half of all issuers.
Visitor management, parking and logical security each received at least 40% response rate (see Figure 3).
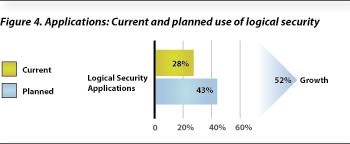
In terms of rise in planned use, there was a significant lift in the number of end users planning to expand use of the ID to logical security–be it network access, file encryption, authentication or single sign on. More than 40% of end users responding to the survey plan to do so in the future, a rise of more than 50% over current levels (see Figure 4).
Security of access control solutions
A series of questions related to the security of current access control solutions. Respondents were asked to rate if they deem a particular security attribute important or unimportant. If they said it is important, they were asked if they are: “SATISFIED with (their) current installed physical access systems related to the specific item.”
The specific attributes identified were:
All six attributes scored as important with an average 90% of respondents indicating so. Respondents were generally satisfied with their current installed solutions. Five of the six attributes averaged 70% satisfaction rate.
The attribute that garners the least satisfaction among the list was, “Hardware that can update security technology if current technology is hacked.” Less than 50% of respondents reported satisfaction with their current installed solution related to this item.
System selection criteria
A series of system attributes or selection criteria was also investigated. Each item was rated as important or not important, and those deemed important were evaluated based on the respondent’s perceived satisfaction with their current solution related to the item.
Two financial questions were posed, one asking about “Price” and another “Total Cost of Ownership.” Not surprisingly, both were deemed important by an overwhelming majority of respondents. In both cases, 60% of respondents reported that they were satisfied with their current solution leaving 40% dissatisfied.
“Capability to Support New Applications with Minimal Investment,” was another system selection criteria investigated. Nearly 90% ranked it important and respondents were split down the middle in terms of satisfaction.
The item, “Credential Form Factor Options (e.g., card, phone, sticker, etc.),” received an importance vote from 70% of respondents, with 40% expressing dissatisfaction with their current solution.
Programming advanced technology credentials
 With the rise in advanced card technology use, the issue of programming credentials into cards has become increasing complicated and essential. Respondents were asked: “Which method(s) does your organization CURRENTLY USE when programming your cards/credentials prior to distribution?” Additionally they were asked what they plan to use in the future.
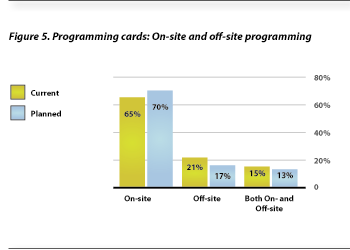
If an access control system supplier or a service bureau provides programmed cards to the site, the response is categorized as “off-site.” If the issuer programs the cards via a desktop printer or a desktop programmer, the response is categorized as “on-site.” In some cases a combination of off-site and on-site programming was reported.
More than 65% of all respondents currently use on-site programming methods and this method’s use is expected to increase to nearly 70% in the future. Both off-site and combined on-site and off-site programming declines from current use rates to planned use rates among survey participants (see Figure 5).
Key drivers for future access control decisions
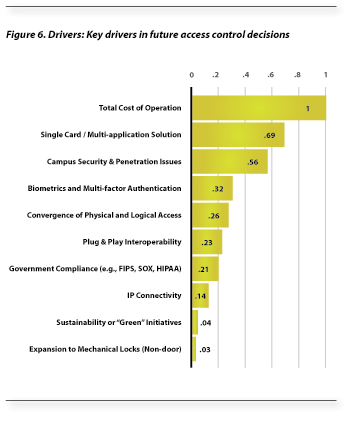 Respondents were asked to select what they feel will be the leading drivers for physical access control in the next three years. Each was asked to select the first, second and third most significant driver from a list of eleven options. For evaluation purposes, first place votes were weighted with three points, second place two points and third place one point.
“Total Cost of Operation” led the list of drivers receiving acknowledgement from nearly 80% of respondents. Using this as the benchmark, the remaining options were compared to this response. “Single Card/Multi-application Solution” ranked second, and “Campus Security & Penetration Issues” ranked third. The remaining responses fell far short of these top three suggesting clear differentiation in perceived importance (see Figure 6).
Conclusions
The Future Trends in Physical Access Control study suggests that security technology is changing, and end users/issuers are acknowledging and planning for many of the changes. This seems evident in the rise in planned use of contactless technology, a strong list of additional card-driven applications being considered and widespread recognition of the importance of security in the solutions deployed.
While this is positive for the access control industry, the user community remains extremely cost conscious. “Total Cost of Operation” ranks as the number one driver for future purchasing decisions, and both “Price” and “Total Cost of Ownership” topped the list of system selection criteria.
It seems users are ready to embrace new solutions and higher levels of security, assuming the price is right.




Notifications